Monitoring LLMs in Production
Quick Summary
While we've thoroughly tested our medical chatbot, it's absolutely necessary to continue monitoring and evaluating your LLM applications post-production. This is crucial for improving your LLM application and identifying bugs as well as areas of improvement. Confident AI offers a complete suite of features to help you and your team easily monitor your LLMs in production, including:
In this section, we'll be focusing on setting up our medical chatbot application for response monitoring and tracing.
For an in-depth dive into LLM observability, consider reading this detailed article on LLM Monitoring and Observability.
To get started with production monitoring, first login to Confident AI:
deepeval login
Setting Up Monitoring
Let’s remind ourselves of the main interactive chat method within our MedicalAppointmentSystem. We’ll be enhancing this function to monitor real-time responses in production.
class MedicalAppointmentSystem():
    ...
    def interactive_session(self):
        print("Welcome to the Medical Diagnosis and Booking System!")
        print("Please enter your symptoms or ask about appointment details.")

        while True:
            user_input = input("Your query: ")
            if user_input.lower() == 'exit':
                break

            response: AgentChatResponse = self.agent.chat(user_input)
            print("Agent Response:", response.response)
DeepEval's monitor function enables tracking of key information, including additional hyperparameters or custom data. This information is logged to Confident AI's Observatory, which features advanced filtering capabilities, making custom data logging especially impactful when applicable.
Visit this section to learn more about leveraging the full capabilities of deepeval.monitor.
Let's see how we can use this monitor function in our interactive_session method:
import deepeval
import time

class MedicalAppointmentSystem():
    ...
    def interactive_session(self):
        print("Welcome to the Medical Diagnosis and Booking System!")
        print("Please enter your symptoms or ask about appointment details.")

        while True:
            user_input = input("Your query: ")
            if user_input.lower() == 'exit':
                break

            start_time = time.time()
            response: AgentChatResponse = self.agent.chat(user_input)
            end_time = time.time()

            print("Agent Response:", response.response)

            # one Api call is all it takes to monitor
            deepeval.monitor(
                event_name="Medical Chatbot",
                model="gpt-4o",
                input=user_input,
                response=response.response,
                retrieval_context=[node.text for node in response.source_nodes],
                completion_time=end_time-start_time,
                # replace with ID of user interacting with your application,
                # leave blank if not available
                distinct_id="user1324",
                # replace with ID of conversation thread from your database,
                # leave blank if not available
                conversation_id="conversation123"
            )
In addition to logging mandatory parameters such as event_name, model, input, and response, we also log optional parameters such as retrieval_context, extracted from the agent response, along with execution time, a mock user ID, and a conversation ID.
If your use case involves a chatbot and is conversational, logging conversation_id allows you to analyze, evaluate, and view entire conversational threads.
Setting Up Tracing
This is a bit more complex than native monitoring and so you can skip this and revisit this section later if you're in a hurry.
Next, we’ll set up tracing for our medical chatbot. Since the medical diagnosis bot is built using LlamaIndex, integrating tracing is as simple as adding a single line of code. The same applies for LangChain-based LLM applications, making it extremely quick and easy to get started.
Monitoring allows you track your most important parameters, while Tracing provides full visibility into the pathways and components your LLM application utilizes to generate a single response for each unique input.
deepeval.trace_llama_index() automatically calls monitor, so you shouldn't call monitor while using tracing to avoid duplicate events. However, if you wish to trace your LLM application while utilizing monitor capabilties, hybrid tracing is required, which we’ll cover in Step 3.
deepeval.trace_llama_index()
Now, when you deploy your LLM application, you’ll gain full visibility into the steps it takes to generate each response, making it easier to debug and identify bottlenecks.
No matter how you built your application—whether using another framework or from scratch—you can create custom (and even hybrid) traces in DeepEval. Explore this complete guide to LLM Tracing to learn how to set it up.
Tracing and Monitor
DeepEval allows you to control what you monitor while leveraging its tracing integrations. To enable hybrid tracing for production response monitoring, you need to call the monitor() method at the end of the root trace block.
This method has the same arguments (and types) as deepeval.monitor().
To get started, wrap your chat logic inside a Tracer block and replace deepeval.monitor with the monitor method of the Tracer instance. You'll also notice that we'll need to call set_attributes() on our instance to avoid any errors.
from deepeval.tracing import Tracer, TraceType

class MedicalAppointmentSystem:
    ...
    def interactive_session(self):
        print("Welcome to the Medical Diagnosis and Booking System!")
        print("Please enter your symptoms or ask about appointment details.")

        while True:
            with Tracer(trace_type=TraceType.AGENT) as agent_trace:

                user_input = input("Your query: ")
                if user_input.lower() == 'exit':
                    break

                start_time = time.time()
                response: AgentChatResponse = self.agent.chat(user_input)
                end_time = time.time()

                agent_trace.monitor(
                    event_name="Medical Chatbot",
                    model="gpt-4o",
                    input=user_input,
                    response=response.response,
                    retrieval_context=[node.text for node in response.source_nodes],
                    completion_time=end_time-start_time,
                    distinct_id="user1324",
                    conversation_id="conversation123"
                )
                print("Agent Response:", response.response)
The LLM application is now fully set up for production monitoring and ready for deployment. In the next sections, we’ll explore how to make the most of Confident AI’s features for effective production monitoring.
Example Interaction
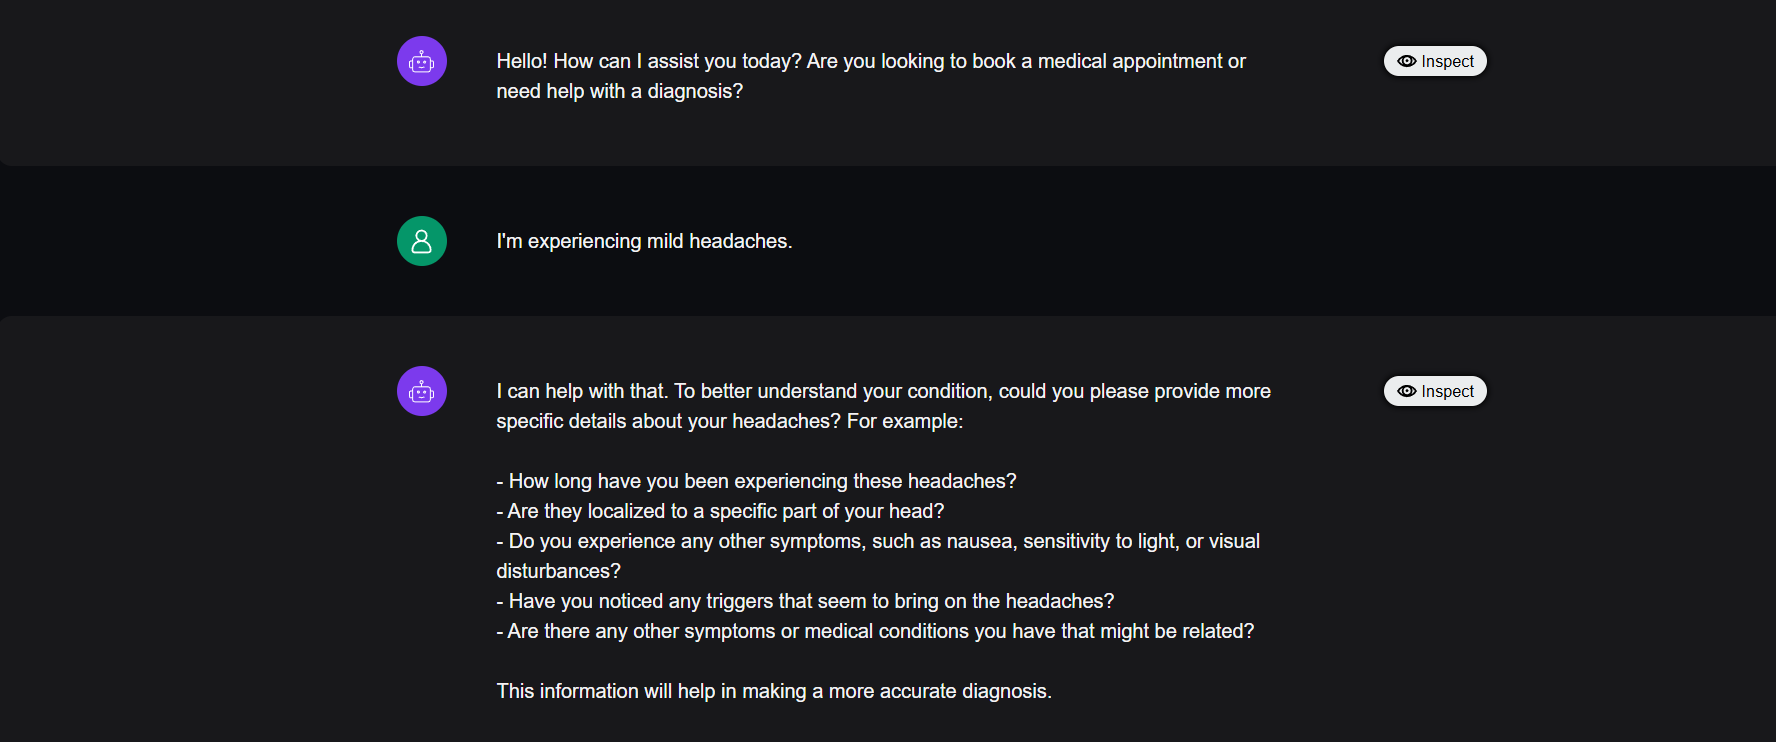
Before diving into the platform, let’s first examine a mock conversation between our medical chatbot and a hypothetical user, Jacob. Jacob is experiencing mild headaches and wants to schedule an appointment with a doctor to address his concerns. We’ll use the Observatory to analyze and review this conversation in the upcoming sections.


Eyeballing LLM Responses in Production
Remember how we eyeballed a few input-response pairs in the beginning when defining our evaluation criteria? Well the idea here is similar. First you inspect some responses, before deciding what metrics you want to use for evaluation in production.
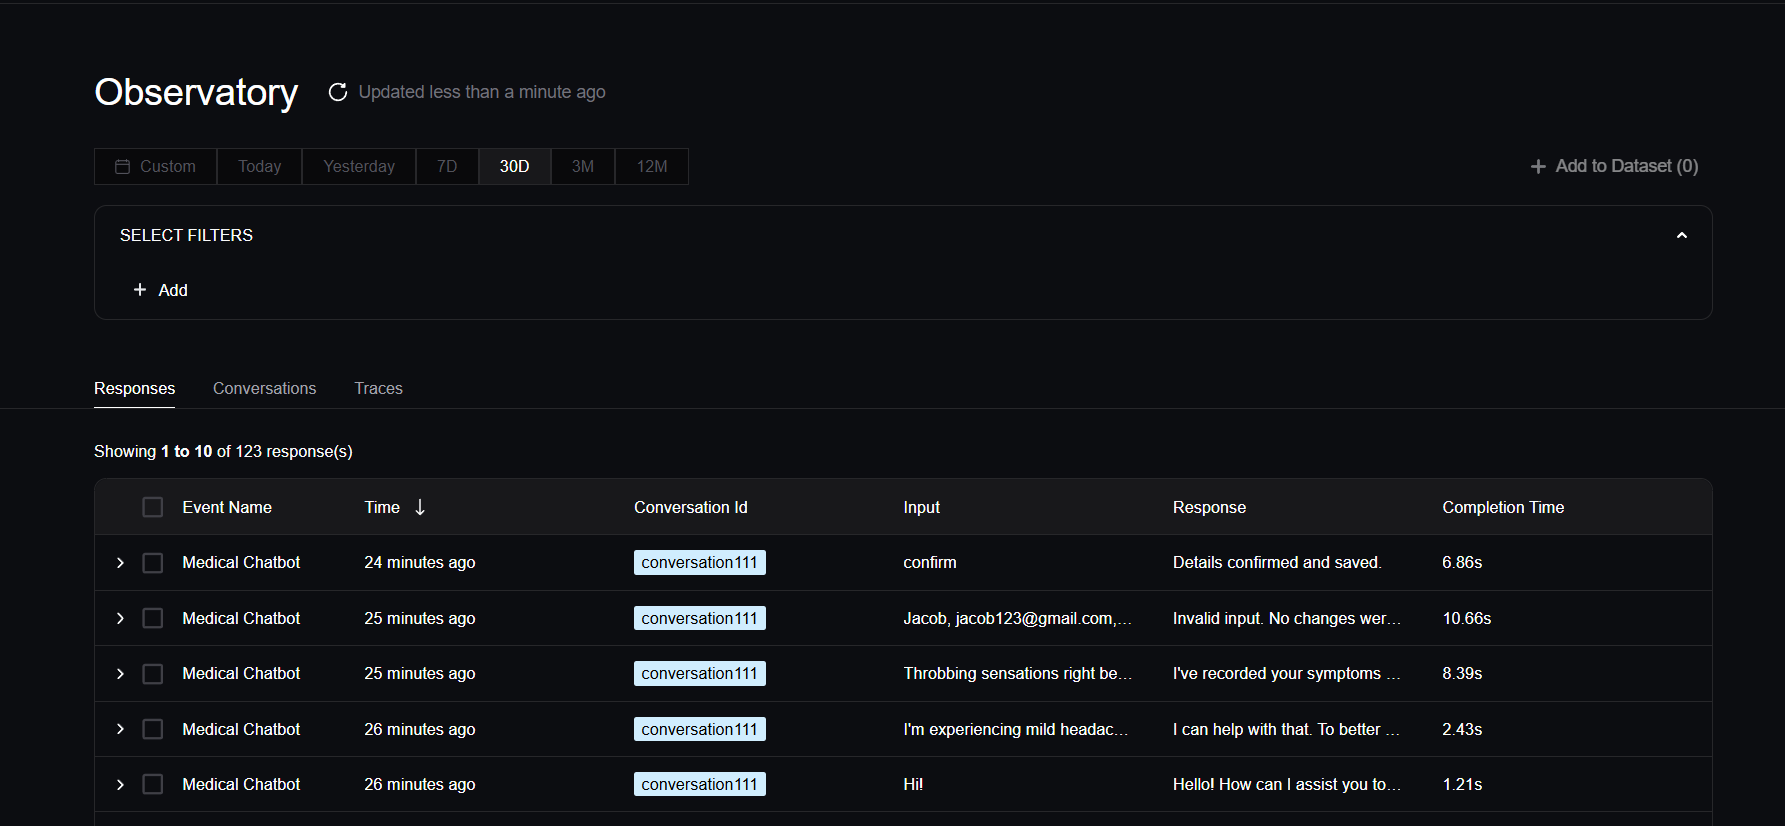
In this section we'll be exploring how to leverage the Confident AI platform for monitoring in production. First, log in to Confident AI and navigate to the Observatory. Here, you can view and filter for responses, view entire conversational threads, leave feedback, and more.

Filtering
Let's start by filtering for all the responses from the conversation and model we want to analyze. We'll filter for the conversation thread set up earlier, conversation_id="conversation111", and focus specifically on responses generated by the GPT-4o model.

In production, deploying multiple versions of your chatbot simultaneously enables (A/B) testing of different models, prompt templates, and configurations. By filtering responses based on these parameters, you can gain valuable insights and pinpoint the most effective setup for your specific use case.
Inspecting Each Response
To inspect each monitored response in more detail, simply click on the corresponding row. The fields displayed in the dropdown align with the parameters we chose to log in our monitor function. Since we did not log token count or token usage, and this specific response did not prompt our chatbot’s RAG engine tool, the fields for token usage, cost, and retrieval are empty.

You're also able to view hyperparameters and custom data, should you choose to log them, next to the All Properties tab and click Inspect to explore the test data in greater detail, including its traces.
Detailed Inspection
Clicking Inspect opens a side drawer where you can review your response in greater detail. You’ll find tabs for default parameters, hyperparameters, and custom data, as well as additional tabs for metrics and feedback.
Metrics and feedback will be covered in the next tutorial as part of evaluating models in production.
For now, let’s click on View Trace to see the full trace of the path our LLM application took for this response.

Viewing Traces
We’ll examine the trace of this specific interaction between Jacob and our medical chatbot.

As shown below, this response prompted the chatbot to call the RAG tool, initiating a complex workflow involving multiple LLMs, retrievers, and synthesizers.
For agent-based applications, these traces often vary depending on the input, as the chatbot dynamically chooses from multiple paths and tool calls to deliver the best response.
All of this was seamlessly automated with just a single line of code!